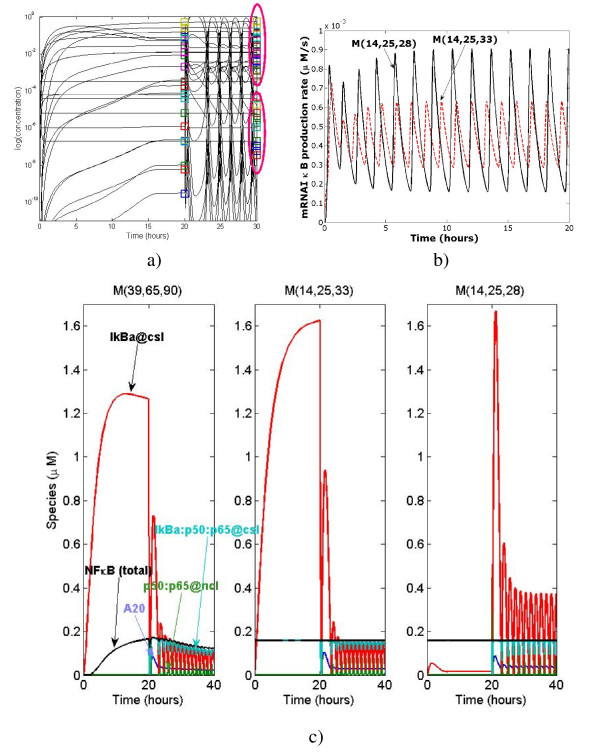
Figure 7.
Model comparison a) Trajectories of various species for the model M (39, 65, 90); quasi-stationary species have concentrations in the lower cluster. b) Production rates of mRNAIκB for two models having the same reactions and species, differing only by one kinetic law. c) Trajectories (signal applied at t = 20). Notice the different behavior of IkBa@csl in ℳ(14, 25, 28).

