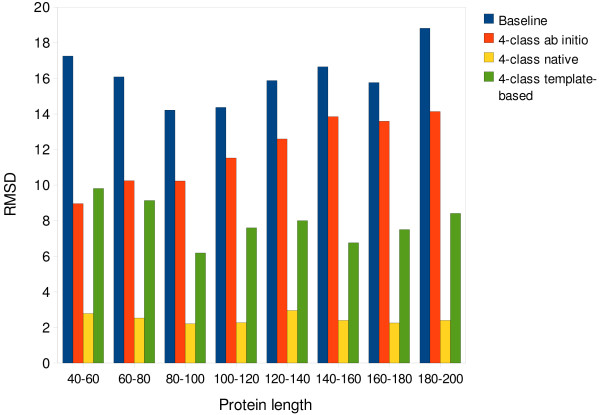
Figure 6.
Reconstructions from 4-class contact maps. Average RMSD vs. sequence length is shown for models derived from true 4-class maps (yellow bins), from 4-class maps predicted using information derived from homologues (MTE) (green bins) and from 4-class maps predicted ab initio (red bins), together with the baseline (blue bins). Note that, since no templates are allowed that show a sequence identity greater than 95% to the query, the MTE results are based on a mixture of good, bad and no templates (see Figure 6 for a sample distribution of template quality). Standard deviations are approximately 1.3 Å for the 40–60 class, 1.1 Å for the 60–80 one and less than 1 Å for the other classes.

