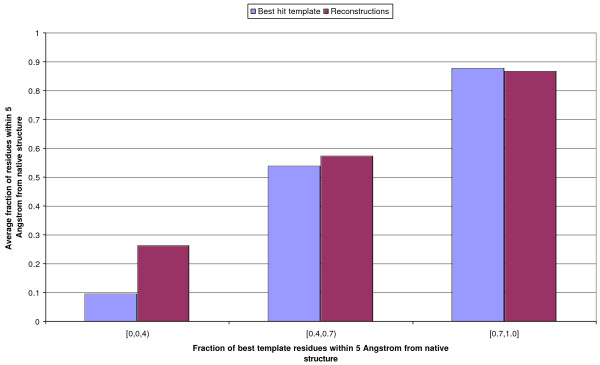
Figure 8.
Quality of 3D models from 4-class maps vs. TM-score of the best template. On the x axis is the fraction of residues in the query which are within 5 Å of the template. The bins' height is proportional to the average fraction of residues in either the 3D model (red bins) or the best template (blue bins) that are within 5 Å of the native structure.

