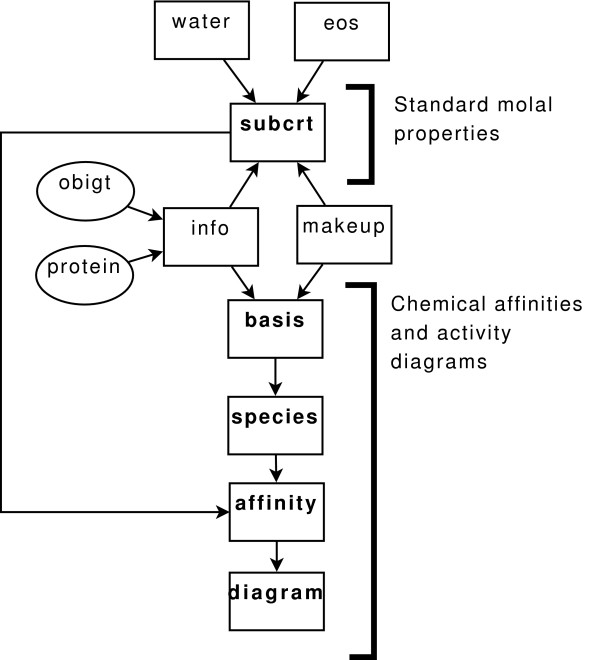
Figure 1.
Functions and data flow in the CHNOSZ program. Data sources are represented by ellipses, and functions by boxes. Computations in CHNOSZ are initiated by the user accessing the primary functions, shown in bold font. The accessory functions, shown in normal font, perform many of the underlying calculations.

