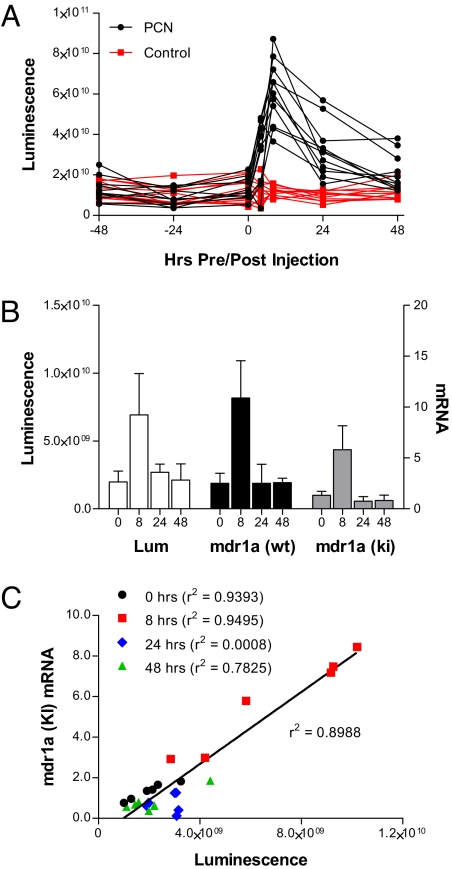
Fig. 3.
Mdr1a gene induction by PCN. Heterozygous mdr1a+/fLUC mice were given 200 mg/kg of PCN by i.p. injection at time 0. Mice that were injected with corn oil were used as control. (A) Luciferase expression was quantified by measuring luminescence intensity in the abdominal area at various time points before and after PCN or vehicle injection. Shown are the luminescence intensities at each time point in each individual mouse. (B) Eighteen mdr1a+/fLUC mice and 18 mdr1a+/+ mice were given PCN (200 mg/kg by i.p. injection) and then groups of 6 mice of each genotype were killed at 8, 24, and 48 h after injection. Mice from Fig. 2B were used as the preinjection (0 h) cohort. Luminescence intensities in the abdominal area were measured immediately before sacrifice and various organs were dissected and frozen immediately after killing. Total RNAs were extracted from the intestinal tissues of each mouse and processed as in Fig. 2. Shown are the average luminescence intensities (Lum) measured in each group of mdr1a+/fLUC mice and the average mdr1a mRNA levels in the intestinal tissues of each group of mdr1a+/fLUC (ki) and mdr1a+/+ (wt) mice. Error bars indicate standard deviations. (C) Regression analysis showing the overall relationship between intestinal mdr1a levels in individual mice and abdominal-area luminescence intensities measured just before killing of those same mice. The correlation coefficient for all data points is shown next to the regression line. The correlation coefficient for data associated with each individual time point is shown next to the respective figure legend. The data for 0 h are the same as those shown in Fig. 2C.

