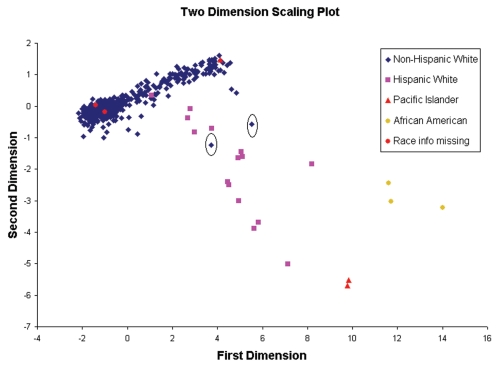
Figure 1.
Population stratification assessments using a two-dimension plot of identity by state (IBS) distances for four self-reported ethnic groups. First and second dimension scales are shown on abscissa and ordinate respectively. Colors indicate different ethnic groups. The dimension scale results were generated from PLINK. Two individuals shown in the circles were considered outliers and excluded from further analysis.

