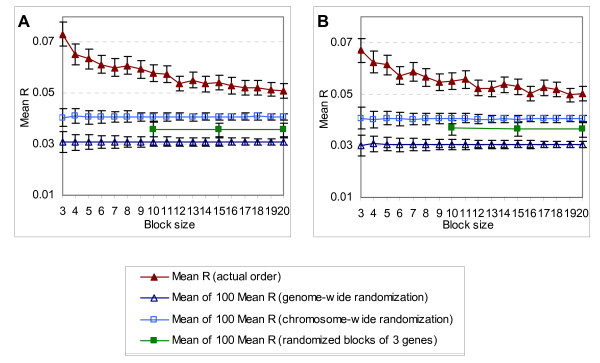
Figure 2.
Mean of pair-wise R values in blocks of size 3 to 20 (▲), shown with standard error. This is compared to the mean of 100 values obtained similarly, each from the same analysis after a random permutation of: (1) the gene order of the entire genome (△); (2) the order of genes in each chromosome (□); (3) the order of non-overlapping blocks of 3 consecutive genes (■). Plots (△), (□) and (■) are shown with standard deviations. The points in (A) are from analyses with the full dataset, while (B) are from analyses after tandem duplicates are removed.

