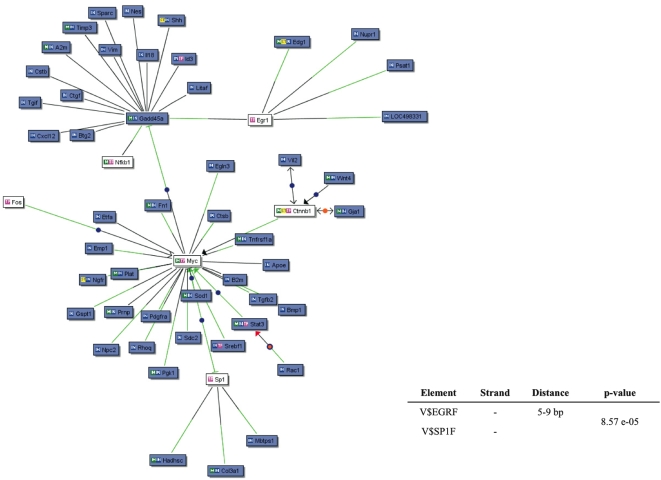
Figure 2. Knowledge-based gene network of the MesPC-specific genes.
The nodes represent the genes. In BLUE, the MesPC-upregulated genes; in WHITE, the transcription factors not included in the list of significant genes that interact with the MesPC specific genes. The BLACK edges indicate co-citation of two genes in the PubMed database; the GREEN edges indicate the presence of a significant TFBS on the promoter of the given gene for the specific interacting transcription factor. Lower-right corner: summary of the regulatory model possibly regulating the expression of MesPC genes. The matrix elements present in the model (V$EGRF and V$SP1F), the DNA strand where they are present on the promoter regions, their relative distance, and the p-value are shown.

