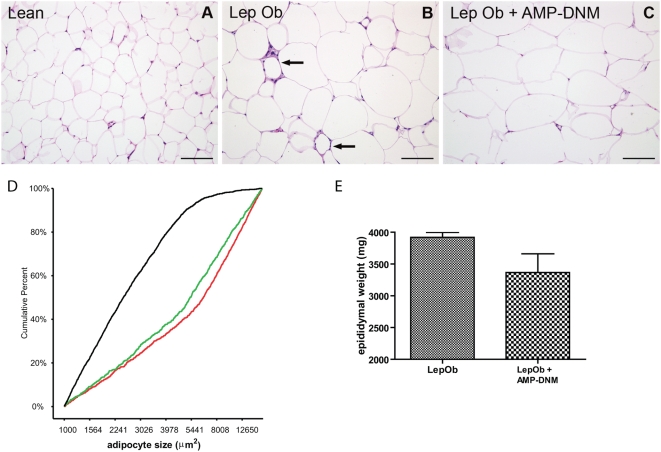
Figure 1. Adipose tissue analysis after lowering of glycosphingolipid content.
Haematoxylin and eosin staining of adipose tissue of (A) lean mice, (B) LepOb mice and (C) LepOb mice following reduction of glycosphingolipid content. (D) Analysis of adipocyte cell size distribution in lean mice (black line), in LepOb mice (red line) and in AMP-DNM treated LepOb mice (green line). (E) EWAT weight. Data are depicted on the Y-axis as mean±S.E.M. (n = 5 per group). Actual p values are depicted in the graphs. Bars in the photographs represent 100 µm. The arrows in panel B indicate crown-like structures. For the distribution of adipocyte size at least 150 cells were analysed per animal (for details see methods).

