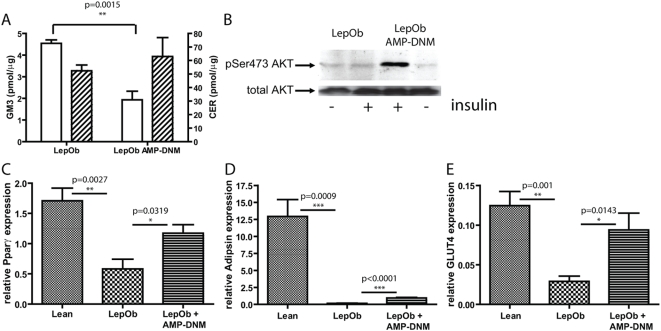
Figure 2. Restoration of insulin signalling and normalization of adipogenesis, following lowering of adipose tissue glycosphingolipid content.
(A) Reduction of GM3 concentration (open bars, left Y-axis), but not ceramide (hatched bars, right Y-axis), in adipose tissue by AMP-DNM (B) Restoration of insulin signalling by insulin as demonstrated by western blot analysis of AKT phosphorylation. Adipogenesis is improved as is demonstrated by real time PCR analysis of (C) Pparγ (D) adipsin and (E) GLUT4. In the graphs values are depicted as mean±S.E.M. (n = 5 per group), with p values indicated in the graphs.

