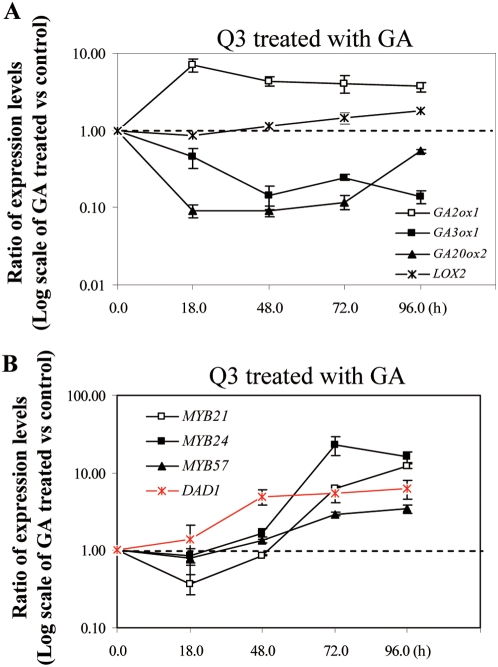
Figure 7. GA Induces DAD1 Expression Prior To Induction of Expression of MYB21, MYB24, and MYB 57.
(A–B) Semi-quantitative analysis of LOX2, GA2ox1, GA3ox1 and GA20ox2 (A), DAD1 (in red line), MYB21, MYB24 and MYB57 (B) expression in the ga1-3 gai-t6 rga-t2 rgl1-1 (Q3) mutant flowers at 18, 48, 72 and 96 hrs after GA treatment. Data were averaged from 2–4 batches of independently treated samples and ACTII was used as the normalization control. The graph was drawn based on Log10 scale of the ratio of the expression levels of GA treated versus untreated samples.

