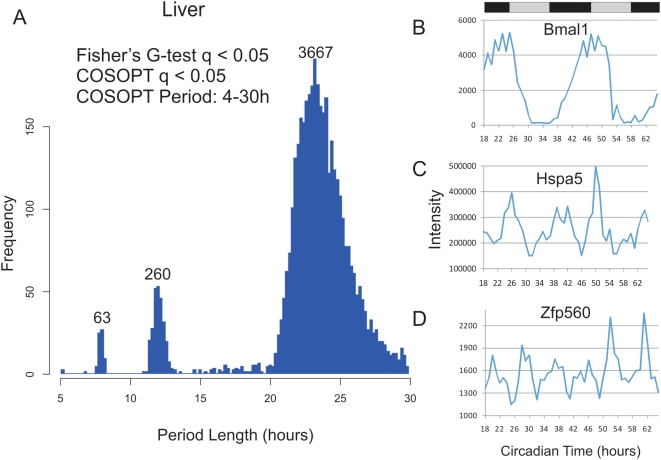
Figure 1. High resolution profiling in the liver identified circadian and sub-ciradian rhythms.
Liver samples were collected every hour for 48 h and analyzed with Affymetrix expression arrays. Rhythmic genes were identified using both COSOPT and Fisher's G-test at a false-discovery rate of <0.05. The period length of every rhythmic transcript was plotted as a histogram; clusters of rhythmic genes with period lengths of approximately 24 (>20 and <30 hours), 12 (>10 and <14 hours) and 8-hours (>7 and <9) were observed (A). In panels B–D, the microarray intensity from three examples was plotted against CT time. Bmal1 (B), Hspa5 (C), and Zfp560 (D) expression profiles demonstrate 24, 12, and 8 h period lengths, respectively.

