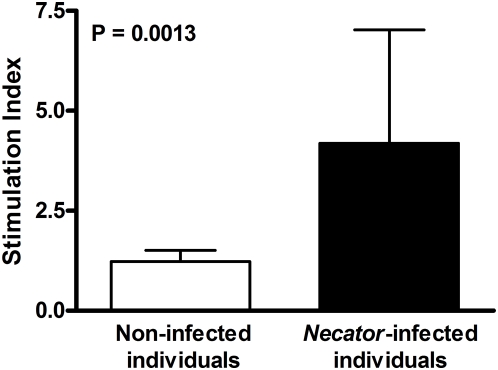
Figure 5. Cell proliferation response of autologous PBMCs after exposure with hookworm stimulated eosinophils from Necator-infected and non-infected individuals.
Results are expressed as stimulation index and the bars represent the mean for each group. Statistical difference between both groups is indicated with the significant P value.

