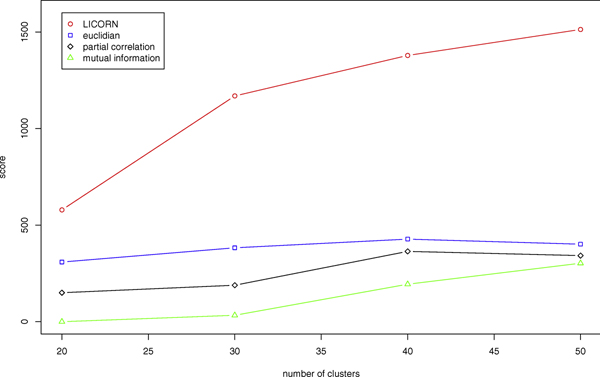
Figure 3.
Comparison of the clustering based on LICORN with existing methods. Figure of the scores obtained for hierarchical clustering into 20, 30, 40 and 50 clusters. The red circles are the scores obtained for the similarity matrix given by LICORN and λ = 0.1. The similarity measures which are compared to are euclidian distance, partial correlation and mutual information.

