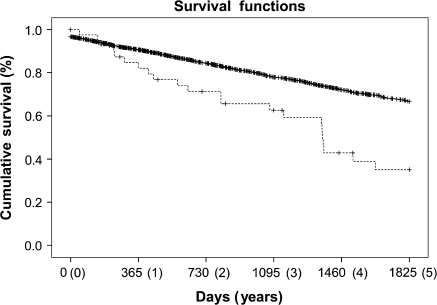
Figure 1.
Kaplan-Meier analysis to compare the cumulative survival curves of 44 biopsy-proven giant cell arteritis (GCA) patients (dashed line) to 4,400 controls (solid line). One-hundred controls were randomly selected for each of the 44 GCA patients after being matched by birth year and gender. The 5-year survival of GCA patients is significantly reduced compared with that of the control group (p < .001).

