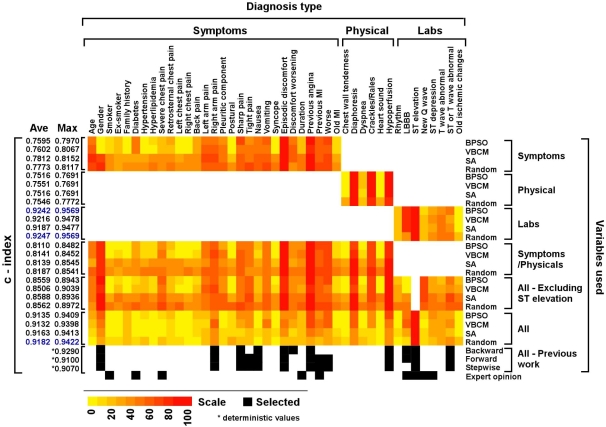
Figure 1.
Predicting risk for MI using different selection methods applied on different sets of diagnostic parameters. Parameters were subdivided into Symptoms (including medical history), physical signs (Physical) and laboratory tests (Labs) and then the c‐index was calculated using four methods; BPSO, VBCM, SA and Stochastic Search (Random) (see text). Previous modeled data [2] and experts opinion [12] are added for comparison. The c‐index for previous data/work is the result of a deterministic run (marked with an asterisk) rather than an average (Ave) of 100 runs as for the techniques we tested. Also maximum (Max) values for our runs are presented. The heatmap was created using Heatmap Builder: http://quertermous.stanford.edu/heatmap.htm. We use the heatmap color‐coded scale to range from yellow to red, which represents the weight of each parameter, meaning the number of times the parameter is selected in the winning set, out of the 100 runs. The black and white colored boxes represent the inclusion and exclusion of the parameters, respectively. The top three c‐indexes in the list are colored blue.

