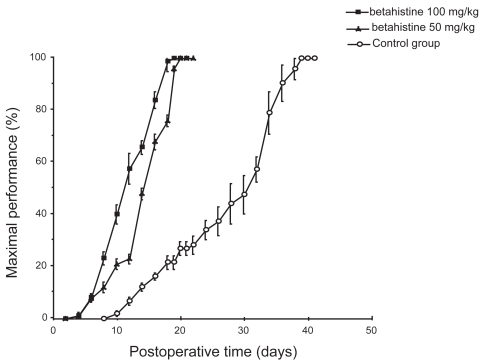
Figure 1.
Mean recovery curves illustrating maximal performance of the cat on the rotating beam. Results are expressed in percent of the preoperative maximal performance (on the ordinates) as a function of the postoperative time in days (on the abscissae). The betahistine groups (50 mg/kg and 100 mg/kg) are shown as solid squares and triangles, respectively, and the control group as open circles. Standard errors of the mean are shown as vertical lines. Note the acceleration of the recovery time under betahistine treatment compared with the controls, and the shortened time required to achieve a full compensation (3 weeks instead of 6 weeks).

