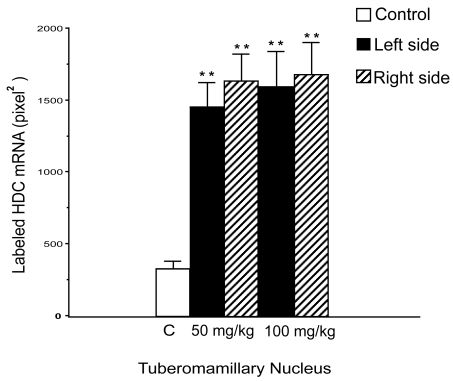
Figure 2.
Quantification of the histidine decarboxylase (HDC) mRNA labeled surface in the right (hatched columns) and left (solid columns) tuberomammillary (TM) nuclei for the two groups of betahistine-treated cats compared with the control, untreated cats (open columns). Note that HDC mRNA labeled surface is significantly increased in the TM nuclei of betahistine-treated cats. ** p < 0.0001.

