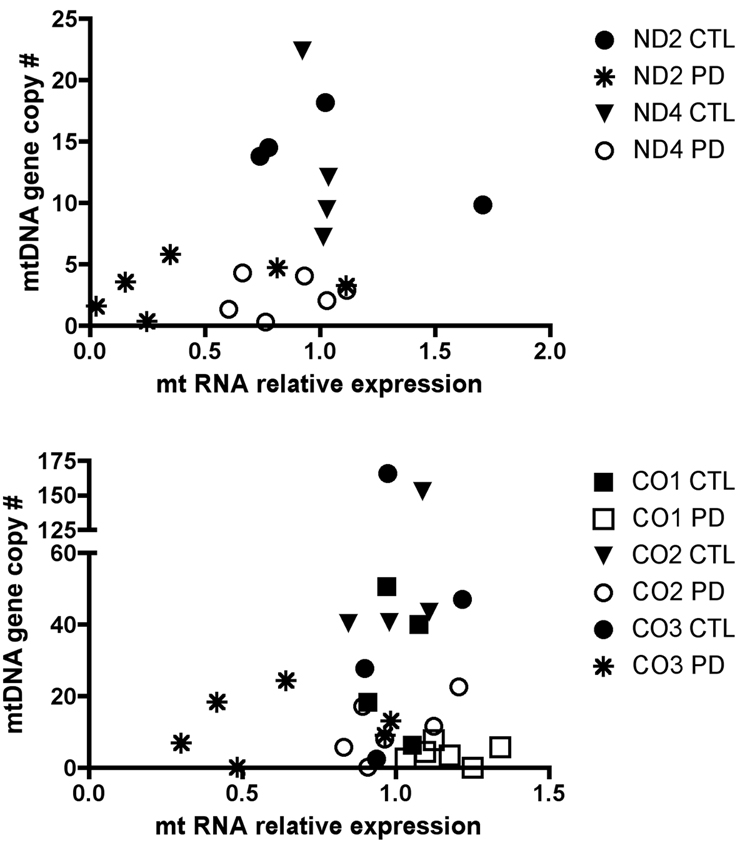
Figure 2.
Comparison of mtDNA copy numbers for ETC genes with relative expression levels of those mtDNA genes in sPD and CTL cybrid lines. mtDNA gene copy numbers were derived as in Figure 1 from DNA samples. Total RNA (1 ug) from each cybrid line was reversed transcribed into cDNA and analyzed with qPCR for levels of mtDNA-encoded genes. The method of Pfaffl [23] was used to calculate relative expression levels compared to the CTL cybrids.

