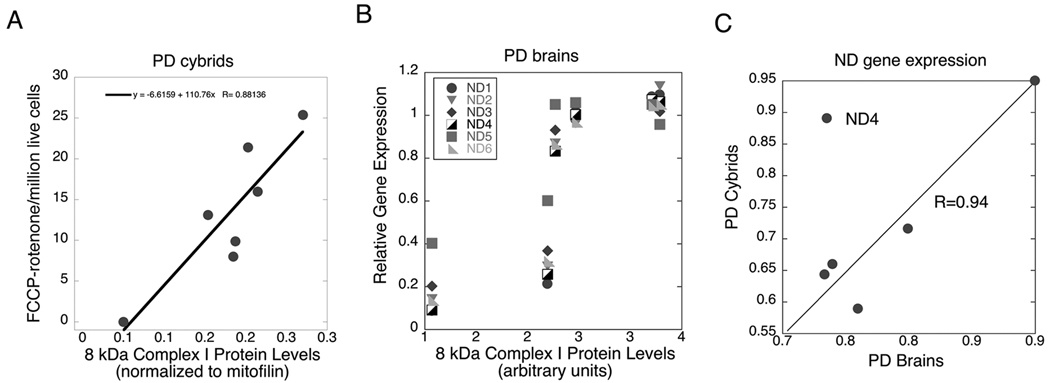
Figure 7.
Inter-relationships among complex I-mediated sPD cybrid respiration, complex I gene expression in sPD cybrids and sPD brains and levels of the 8 kDa complex I protein detected with the MS109 antibody from Mitosciences (see Supplemental Figure 1 and [22]). 7A shows the relationship in sPD cybrids between maximal complex I-mediated respiration and 8 kDa protein levels (normalized to mitofilin) in gradient-purified mitochondria from these cells; R=0.88). 7B shows the relationships among 8 kDa complex I protein levels in gradient-purified mitochondria from sPD brains and mtDNA-encoded complex I gene expression in the sPD brain samples; R varies from 0.78 to 0.88. 7C shows the relationship between mtDNA-encoded complex I gene relative expression in sPD cybrid cells compared to sPD brain. The outlier ND4 was not included in the regression analysis.

