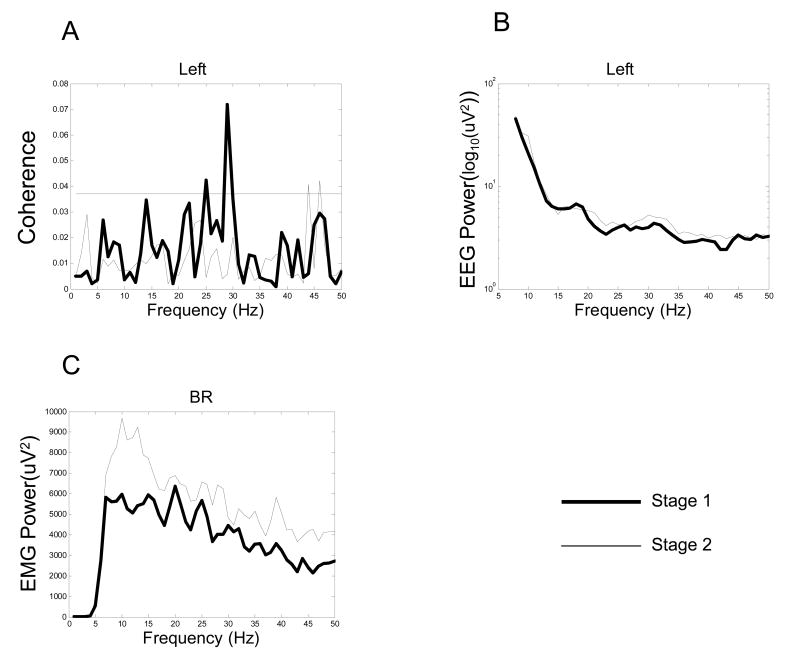
Fig. 2.
A single-subject example of average EEG-EMG coherence spectra between EEG of the left area and EMG of the brachioradialis (BR) muscle (A), EEG power spectrum of the left area (B), and EMG power spectrum of the BR muscle (C) in the two stages. On the coherence spectrum (A), a significant coherence peak at 30 Hz is clearly seen in stage 1 (thick line). In stage 2, however, the significant coherence peak disappeared (thin line). The horizontal line in A indicates 95% confidence level. The EEG power increased in stage 2 (thin line), especially in beta band (B). The EMG power elevated on the entire analyzed spectrum (C) in stage 2 (thin line).

