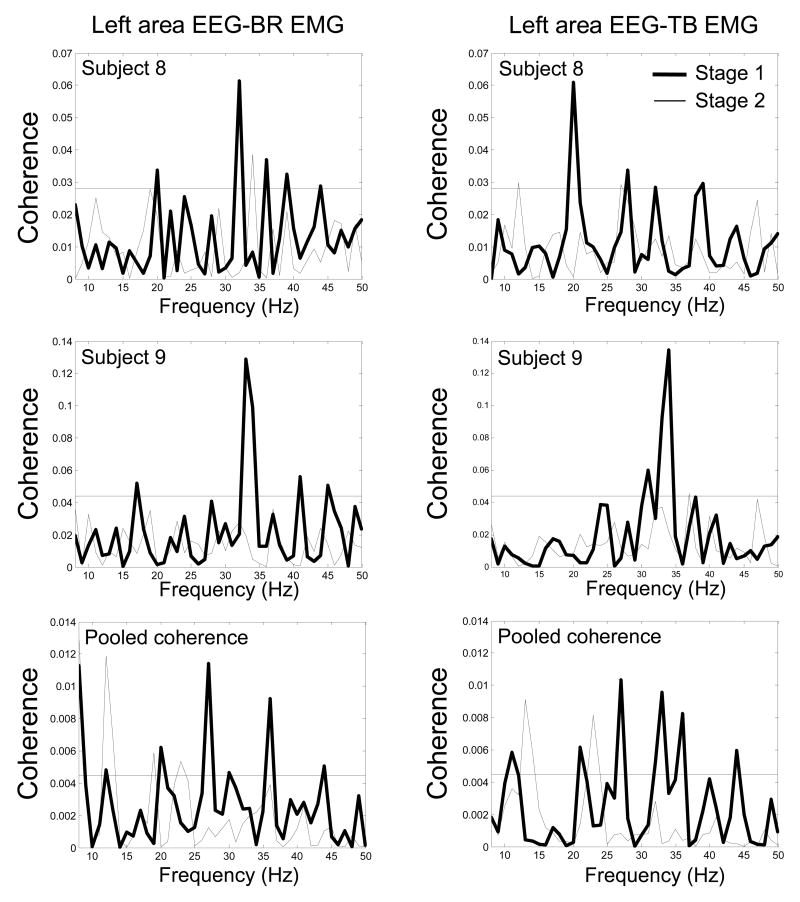
Fig. 3.
Coherence spectra of two individual subjects (subject 8, top row; subject 9, middle row) and the pooled spectra (bottom row) from the electrodes with the maximum coherence in stage 1 between the left scalp area EEG and BR EMG (left column), and left area EEG and TB EMG (right column) in the two stages. The coherence peaks at beta band in stage 1 (thick lines) either decreased or disappeared almost entirely in stage 2 (thin lines). The horizontal line in each plot indicates 95% confidence level.

