
Fig. 4.
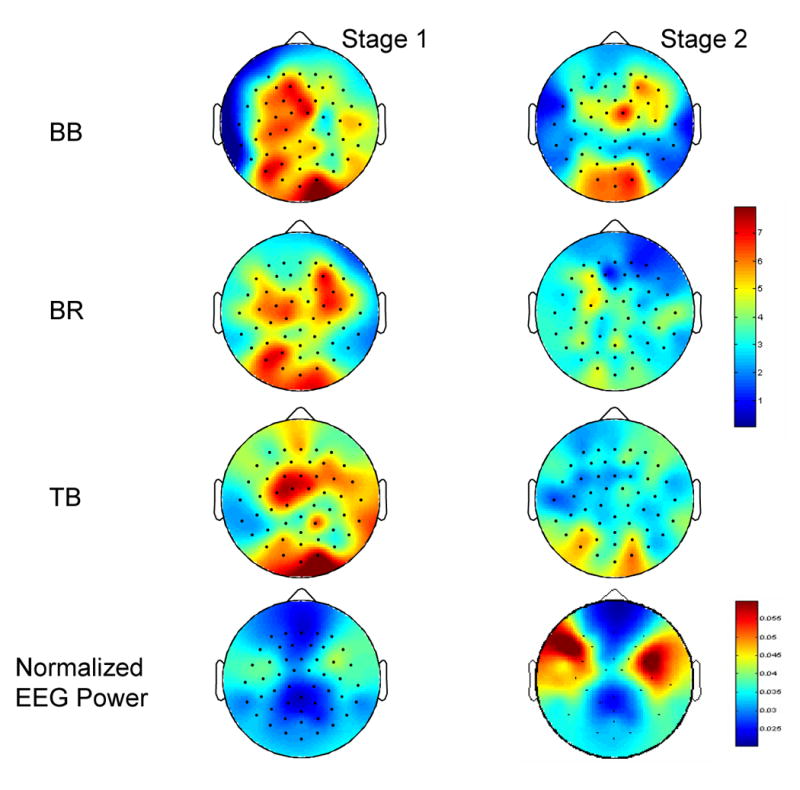
Mapping of EEG-EMG coherence (frist three rows) based on coherence values of electrodes within the five selected scalp areas with EMG of the three muscles at beta (15-35 Hz) band in 9 subjects and mapping of normalized EEG power (bottom row) averaged across 9 subjects. The upper color bar indicates Z-transformed coherence values. The lower color bar indicates normalized EEG power values. The level of coherence declined substantially in stage 2 (fatigue condition, right column) compared with stage 1 (left column). The EEG power increased significantly in the upper left and right scalp areas in stage 2.