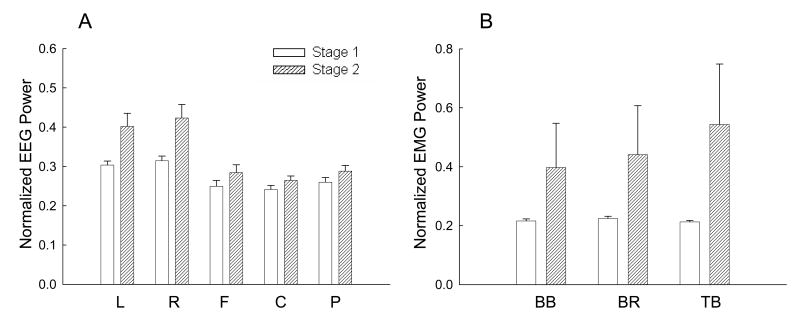
Fig. 6.
Comparisons of the mean normalized EEG power of the five scalp areas and EMG power of the three muscles at beta band (15-35Hz) between stages 1 and 2. Data were based on results of nine subjects. Each normalized EEG power value in each area in each subject was an average of the values from all the electrodes in that area at beta band normalized to the total EEG power (3-50 Hz) in stage 1 of the same area. Similarly, the EMG power at beta band for each muscle was normalized to the total EMG power (10-125 Hz) in stage 1 of the same muscle. Both the EEG and EMG power increased with muscle fatigue (P < 0.01). Because there were no significant stage-area (EEG) and stage-muscle (EMG) interactions, no post-hoc pair-wise comparisons were performed. BB, biceps brachii; BR, brachioradialis; TB, triceps brachii; L, left area; R, right area; F, frontal area; C, central area; P, parietal area.

