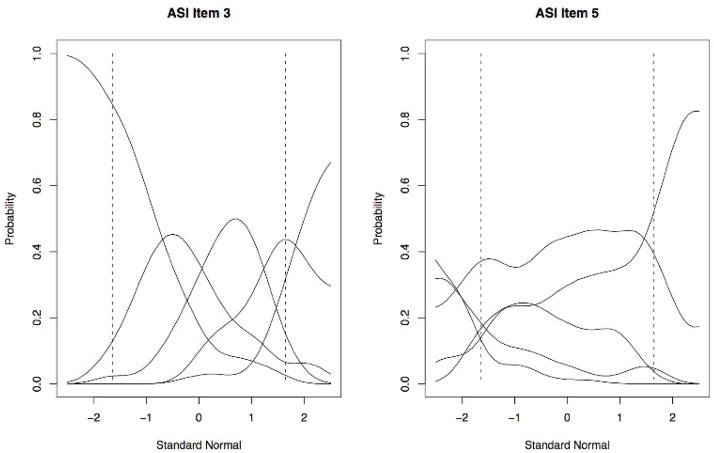
Figure 1.
Option Characteristic Curves obtained from the nonparametric item response model. Item 3 demonstrated good psychometric properties in that each response option was effective in making a unique discrimination across levels of AS. Item 5, in comparison, is dominated by a single response option throughout most of the distribution of scores. Vertical dashed lines indicate the 5th and 94th percentiles of levels of AS for this sample.

