
Figure 5.
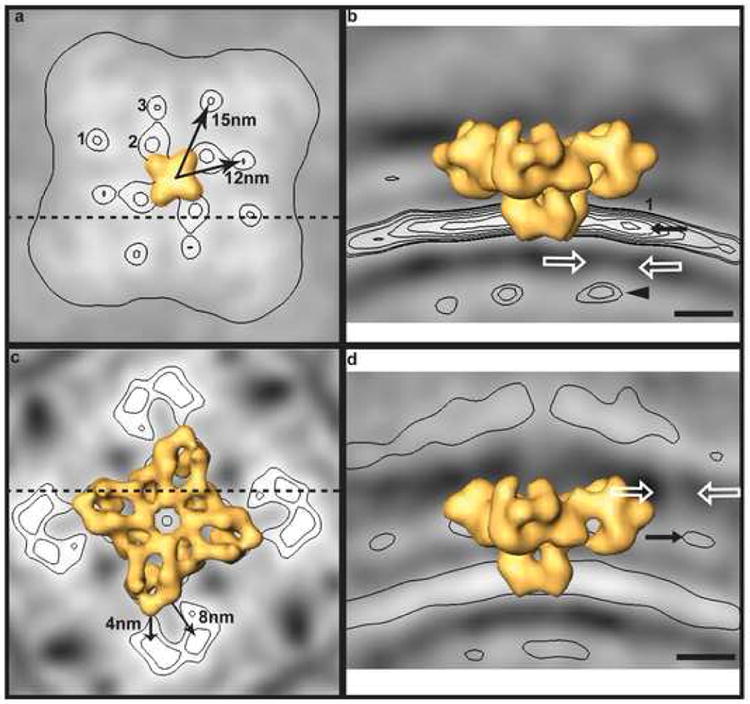
Secondary density maxima in RyR class averages and possible tethers from the SR membrane to calsequestrin and TT membrane. (a) Secondary maxima in the plane of the SR membrane in the Class N average. Membrane-spanning domain of the RyR template is rendered in yellow. (b) Transverse slice through the Class N average (at dashed line in (a)) showing faint density (white arrows) connecting an SR density (black arrow) to calsequestrin (black arrowhead). (c) Cytoplasmic densities in average of the subset of Class S with TT membranes nearby. (d) Transverse slice through the TT subaverage of Class S (at dashed line in (c)) showing faint density (white arrows) connecting the cytoplasmic density (black arrows) to the TT membrane. The planes shown in (a) and (c) correspond to orthogonal slices in the direction of the black arrows in (b) and (d). Scale bars equal 10 nm.