
Figure 6.
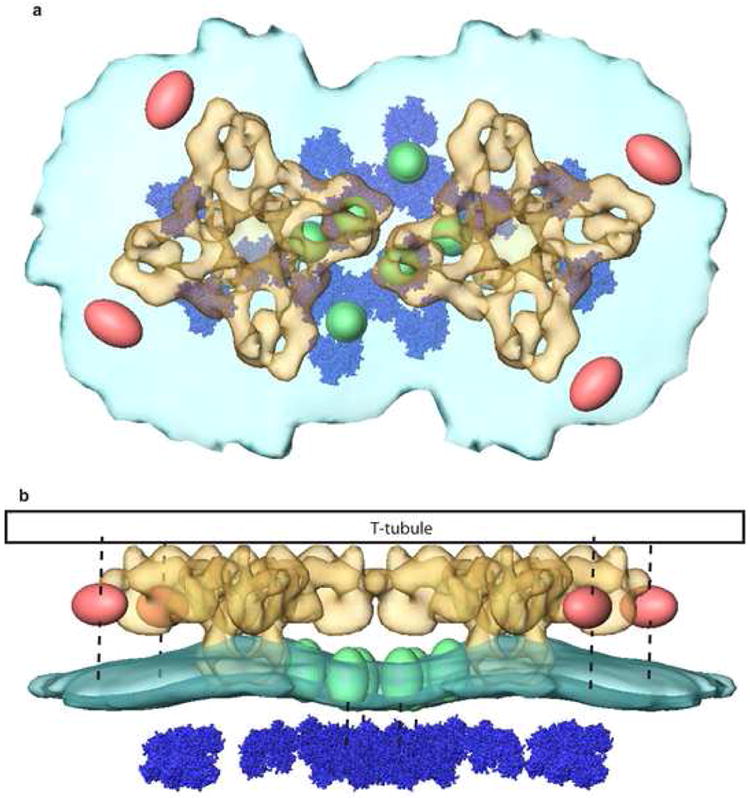
Partial model for the triad junction “couplon” based on cryo-electron tomography. Top: View from above the SR membrane (light blue) showing RyR (yellow), calsequestrin (dark blue), secondary SR membrane densities (green), and cytoplasmic TT-associated densities (pink). Bottom: Side view of the couplon model showing expected location of the TT membrane (black) and tethers (dashed lines) inferred from the class averages in Figure 5.