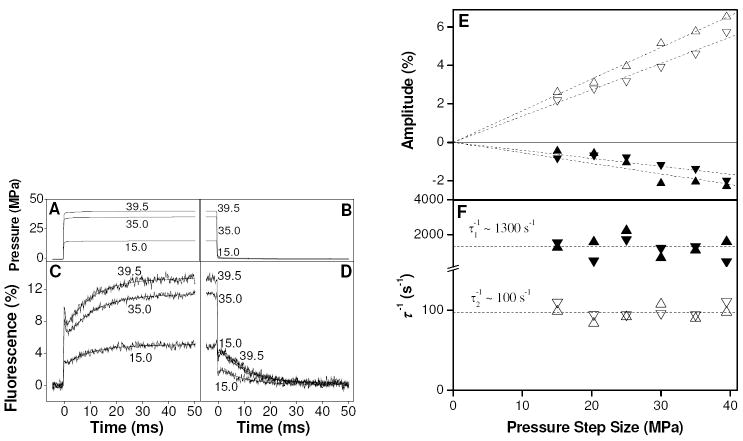
Figure 2.
(A-D) Example transients from the pressure jump showing the results of repeated fast 15.0, 35.0 and 39.5 MPa jumps on 10 μM TnC F29W at pCa 5.6, including 2 mM magnesium. Panels A-B show the pressure transients for this sample (single measurement each). Panels C-D show fluorescence transients (averaged over 600-1500 repeats), with double exponential fits superimposed. (E-F) Effect of pressure step size on amplitude (E) and inverse time constant (F) of fluorescence response. The amplitudes of phases 1 and 2 were linear in pressure step. The slopes for phase 1 were -0.05 ± 0.006 and -0.04 ± 0.003 %.MPa-1 for pressure increase (▲) and pressure decrease (▼), respectively. The slopes for phase 2 were 0.165 ± 0.002 and 0.144 ± 0.003 %.MPa-1 for pressure increase (△) and pressure decrease (▽), respectively. The inverse time constants were invariant (1/τ1 ~ 1300 ± 150 s-1 and 1/τ2 = 97 ± 2 s-1) within the accuracy of the measurements.

