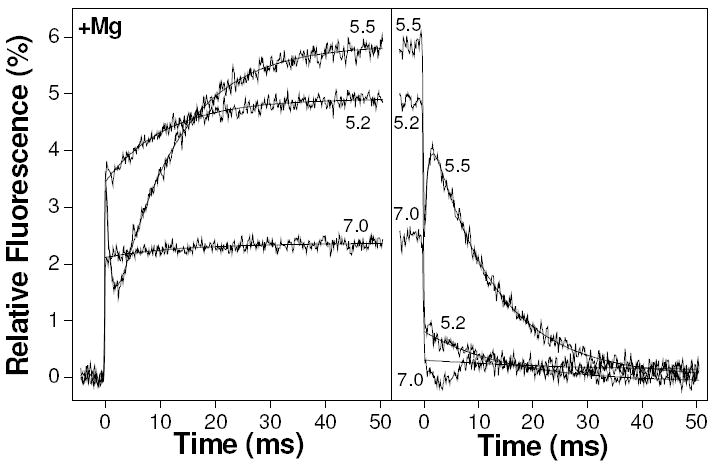
Figure 3.

Example transients from the pressure jump showing the results of 35 MPa pressure jumps on 10 μM TnC F29W containing various concentrations of free calcium (indicated as pCa values, adjacent to appropriate curves), in the presence of 2 mM magnesium. The left panel is the result of pressure increase whilst the right panel is the result of pressure release.
