
Figure 8.
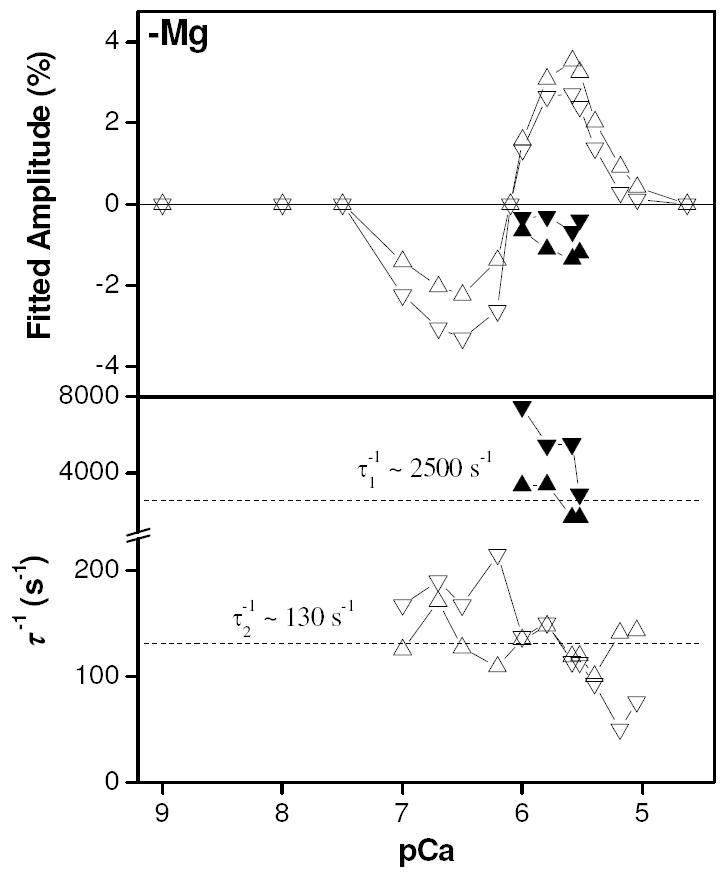
Amplitude plot of results of exponential fitting to pressure jump data obtained in the absence of magnesium as a function of pCa (upper). Plot of inverse relaxation times from exponential fitting to pressure jump transients (lower). Upward pointing triangles (phase 1 = ▲, phase 2 = △) indicate results from pressure application whilst downward pointing triangles (phase 1 = ▼, phase 2 = ▽) indicate results from pressure release.