
Figure 2.
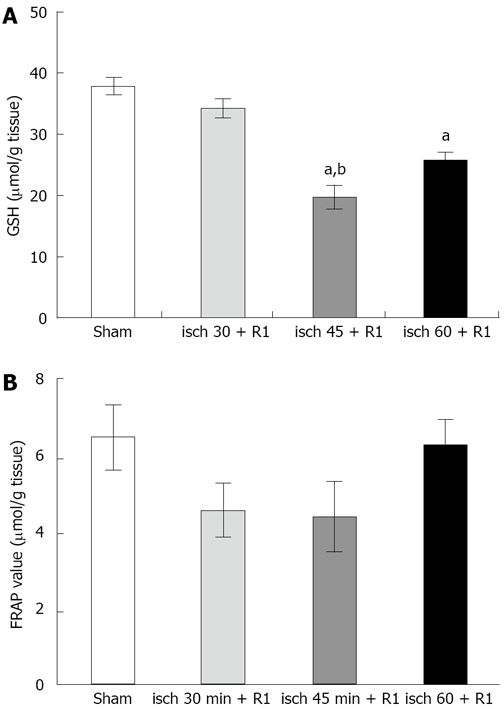
Alterations in liver GSH (A) and FRAP (B) during different renal I/R periods. The data are presented as mean ± SE. aP < 0.05 vs sham-operated group; bP < 0.05 vs 30-min ischemia group. All ischemic periods were followed by 1 h reperfusion.
Official websites use .gov
A
.gov website belongs to an official
government organization in the United States.
Secure .gov websites use HTTPS
A lock (
) or https:// means you've safely
connected to the .gov website. Share sensitive
information only on official, secure websites.
Alterations in liver GSH (A) and FRAP (B) during different renal I/R periods. The data are presented as mean ± SE. aP < 0.05 vs sham-operated group; bP < 0.05 vs 30-min ischemia group. All ischemic periods were followed by 1 h reperfusion.