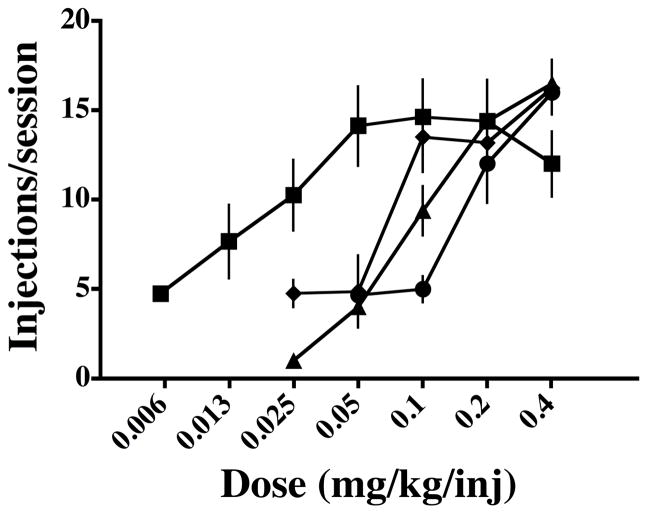
Figure 2.
Dose-response curves for self-administration of cocaine and cocaine:PB mixtures under a PR schedule of reinforcement. Squares represent cocaine alone; diamonds represent cocaine with PB 0.05 mg/kg/injection; triangles represent cocaine with PB 0.1 mg/kg/injection; circles represent cocaine with PB 0.2 mg/kg/injection. Symbols represent the mean values for four monkeys and vertical line are s.e.m.

