Figure 3.
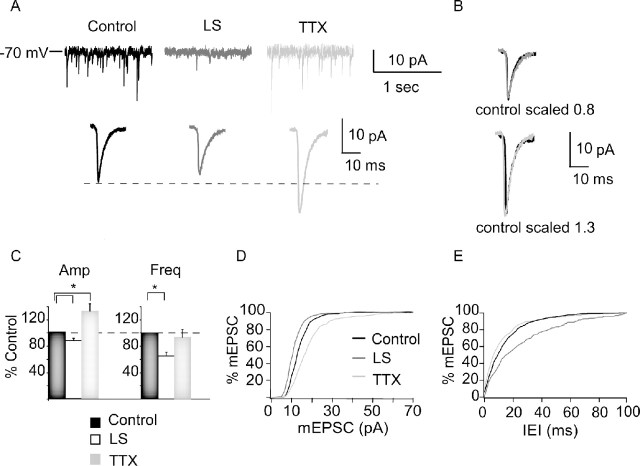
TTX increases, whereas LS decreases, mEPSC amplitude. A, Example traces showing raw mEPSC recordings (top) and average mEPSCs (bottom) for control (black), LS (dark gray), and TTX (light gray) conditions. B, Scaled average mEPSCs for each condition; control scaled to peak of LS (top) and to peak of TTX (bottom). Note similar kinetics in each condition. C, Average mEPSC amplitude (Amp) and frequency (Freq), computed for each neuron and then averaged for each condition. Data are presented as percentage of control. Black bar, Control; white bar, LS; gray bar, TTX. D, Cumulative distribution of mEPSC amplitudes in control (black), LS (dark gray), and TTX (light gray). E, Cumulative distributions of intereven intervals (IEI) between mEPSC for control (black), LS (dark gray), and TTX (light gray) conditions. For cumulative histograms, 50 events/neuron were included. *Significantly different from control.

