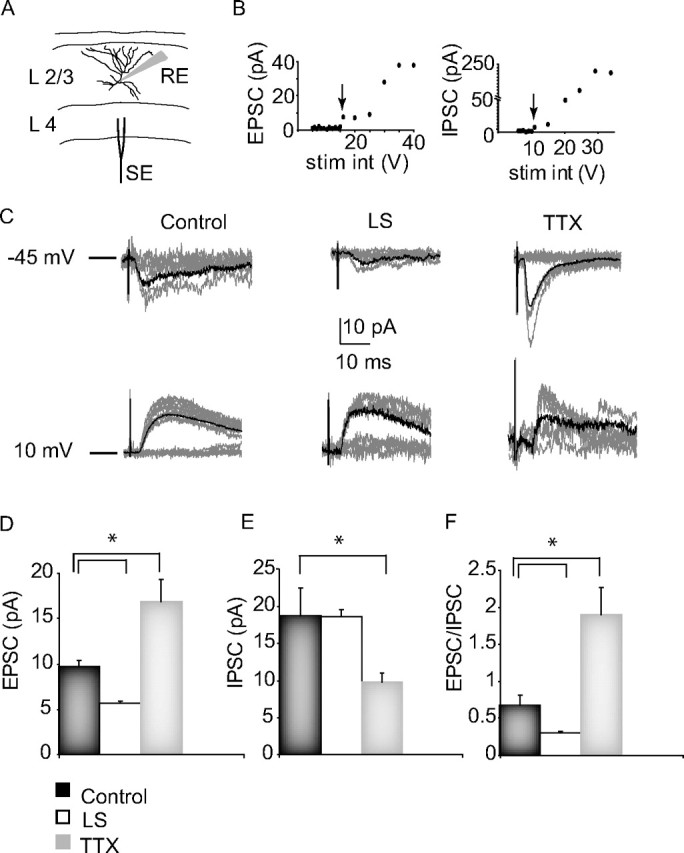
Figure 5.

The effects of visual deprivation on evoked minimal synaptic transmission onto layer 2/3 pyramidal neurons from lower layers. A, Diagram of the experimental setup, showing the laminar and lateral positions of the whole-cell recording (RE) and the bipolar stimulating electrode (SE), and a morphological reconstruction of a layer 2/3 pyramidal neuron. B, Example EPSC and IPSC amplitude versus stimulus intensity (stim int) plots. The arrows indicate the minimal EPSC and IPSC for this neuron. C, Example minimal evoked EPSCs (−45 mV) and IPSCs (+10 mV) from control, LS, and TTX conditions. Each plot shows 10 responses for each condition (gray traces). The average of 30 events for each condition is overlaid in black. D, Average amplitudes (EPSC), paired-pulse ratio (PP ratio), and CV of minimal EPSC for control (black bar), LS (white bar), and TTX (gray bar) conditions. The same color code will be used also for the plots in E and F. E, Average amplitude (IPSC), PP ratio, and CV of minimal IPSC for each condition. F, Average EPSC/IPSC ratio (computed for each neuron and then averaged for each condition). *Significantly different from control.
