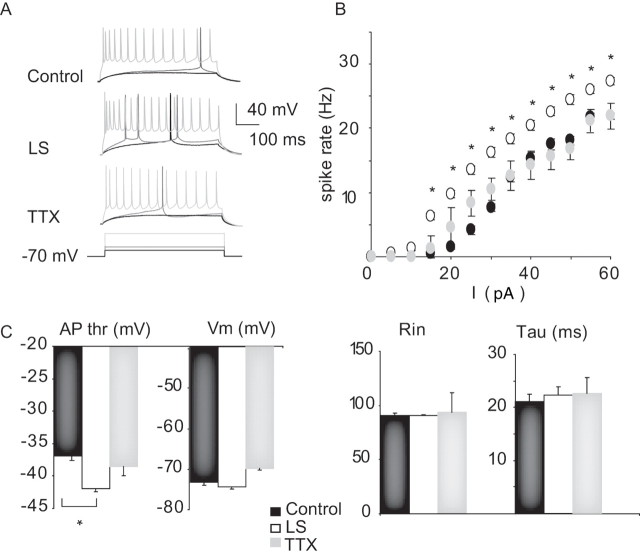
Figure 6.
Plasticity of intrinsic excitability. A, Example firing in response to DC depolarizing current steps for control, LS, and TTX conditions. For each neuron, the response to the same three current injection amplitudes are shown from low (black) to middle (dark gray) to high (light gray). B, Frequency versus current curves for control (black circles), LS (white circles), and TTX (gray circles) conditions. Asterisks highlight significant differences. C, Summary plots for action potential threshold (AP thr), resting membrane potential (V m), resting input resistance (R in), and membrane time constant (tau) for control (black bar), LS (white bar), and TTX (gray bar). Data are mean ± SEM. *Different from control.

