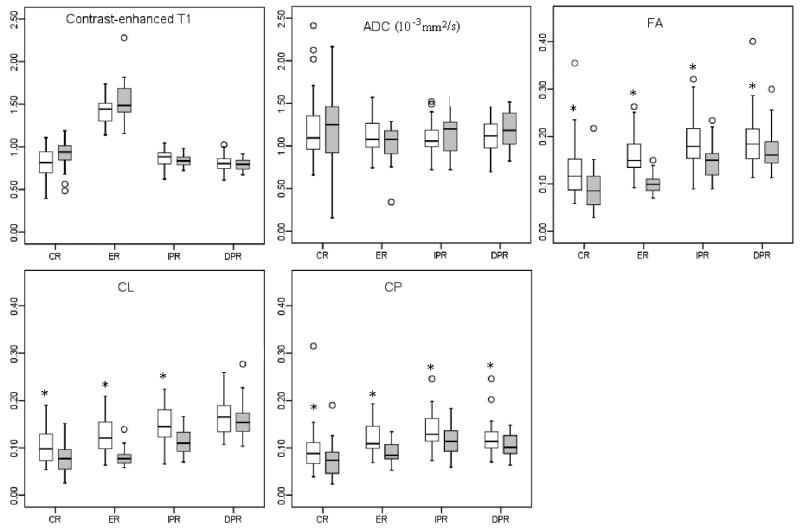
Figure 4.
Box plot of imaging characteristics in glioblastomas (white box) and brain metastases (gray box). Boxes represent the 25th and 75th percentiles with the medians indicated by the middle lines in the boxes. Vertical bars (whiskers) indicate the range of data except the outliers (values more than 1.5 times of the box length larger than the 75th percentile or smaller than the 25th percentile) represented by circles. * indicates significant differences (p < 0.05) between glioblastomas and brain metastases. CR: central region. ER: enhancing region. IPR: immediate peritumoral region. DPR: distant peritumoral region

