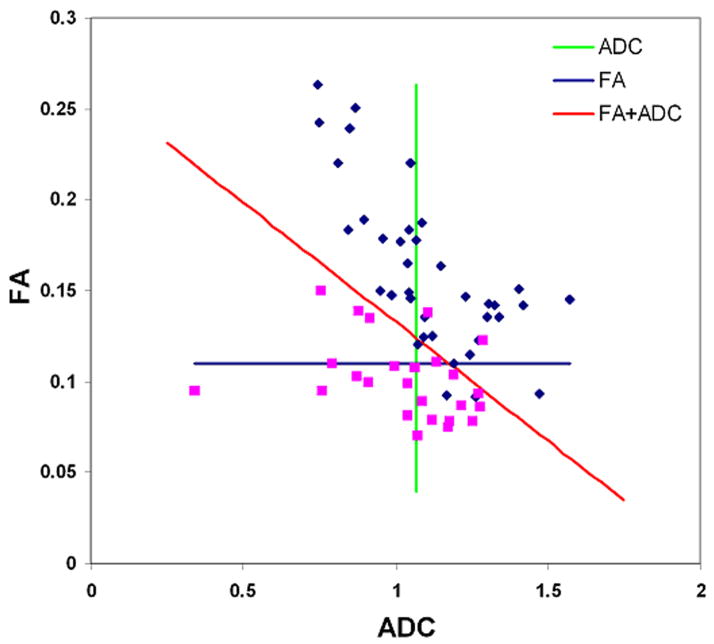
Figure 6.
Scatter plot of FA and ADC from the enhancing region of glioblastomas (blue square) and brain metastases (purple square). The vertical green line is the cutoff line for ADC (cutoff value = 1.07 as shown in Table 2), which does not separate glioblastomas from metastases well enough. The horizontal blue line is the cutoff line for FA (cutoff value = 0.11 as in Table 2), which separates glioblastomas from metastases better than ADC. The diagonal red line is the cutoff line for the combined model of FA and ADC, which divides glioblastomas and metastases much better than FA or ADC alone.

