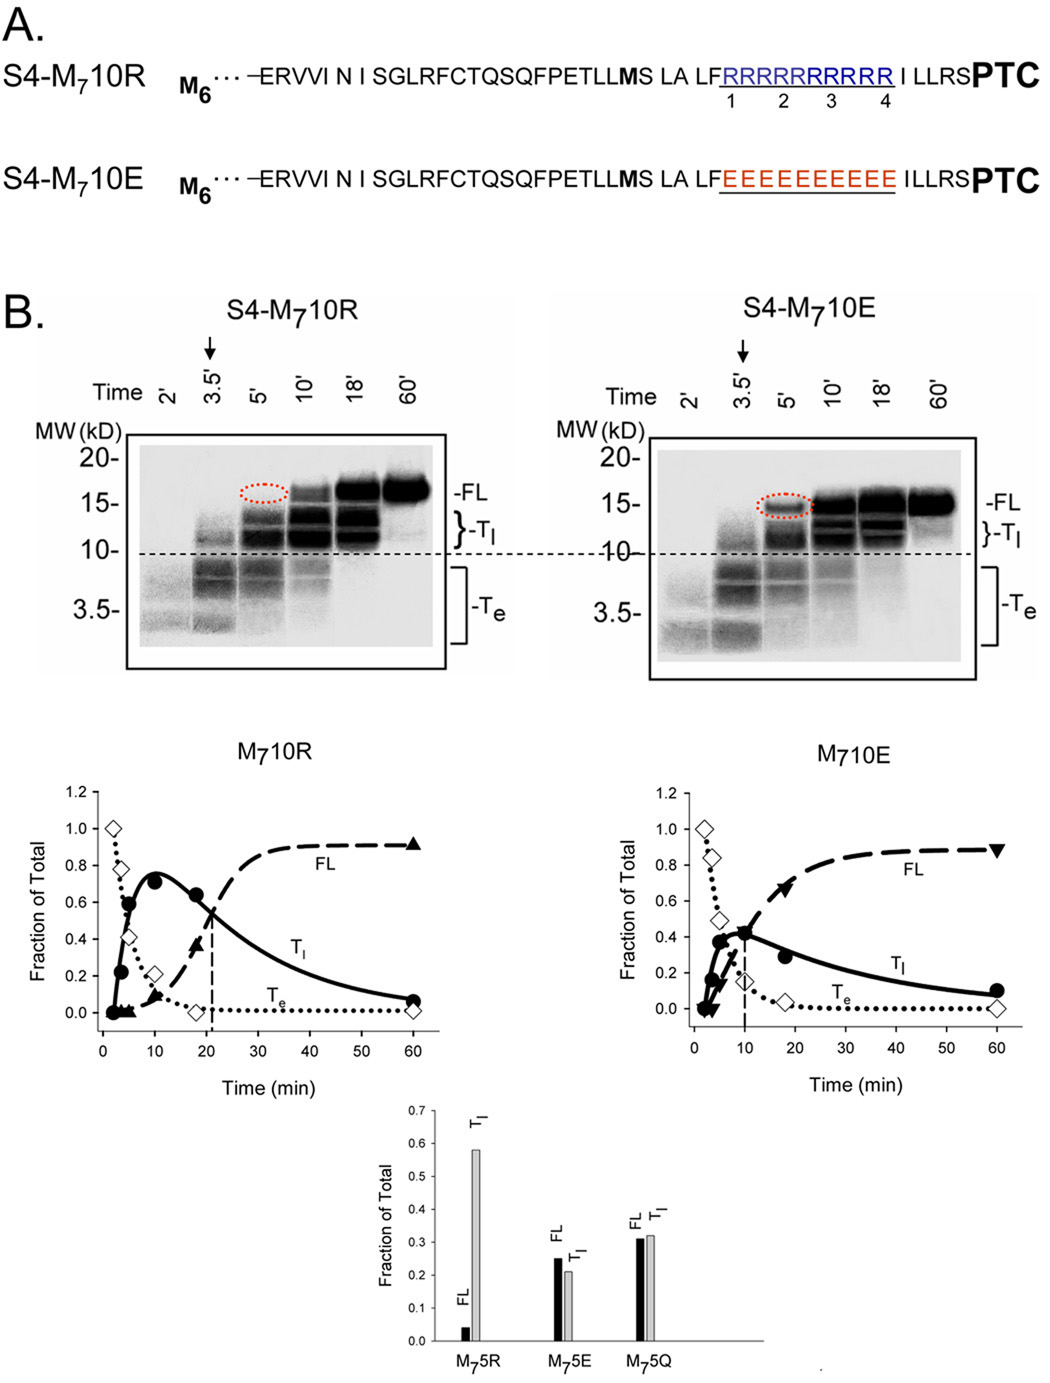
Figure 3. Pulse-chase studies of S4-substituted tape measures.
A. Schematic sequences of methionine-enriched S4-substituted tape measures with 10 consecutive charges. S4-M710R and S4-M710E designate constructs with a total of 7 methionines (bolded) and either 10 consecutive arginines (blue) or 10 consecutive glutamates (red), which replace R1–R4 and the intervening residues in the original S4-substituted tape measure. B. Translation time course for the constructs shown in A. Translation was carried out as described in the Materials and Methods. At the time indicated by the arrow (3.5 min), 1 mM non-radioactive methionine (103-fold dilution of radioactive methionine) was added and additional time points sampled. Samples were fractionated on NuPAGE gels (Bis-Tris 12%, top row; lanes 1–6 loaded with 8, 8, 6, 3, 3, and 3 µl, respectively). The dashed red oval highlights the absence and presence, respectively, of a FL band for S4-M710R and S4-M710E. The data are plotted as fraction of total peptide at the indicated times (below gels). The fraction of a specified population (full-length (FL), early transient (Te), late transient (Tl)) peptide was calculated as the intensity of the specified band divided by the sum of the intensities of all the bands in a given lane. The intensity of Te was multiplied by 1.167 to normalize peptide species containing 6 methionines to the FL containing 7 methionines. The FL data were fit with a sigmoidal function, the Te data with an exponential decay function, and the Tl data with a double exponential (4-parameter) function to give the corresponding solid curves. The vertical line indicates the Tc value, the time at which the fraction of FL equals the fraction of Tl. The bar graph shows results obtained at 5 min from similar experiments using M75R, M75E, and M75Q, which were analyzed as described above.

