Fig. 6.
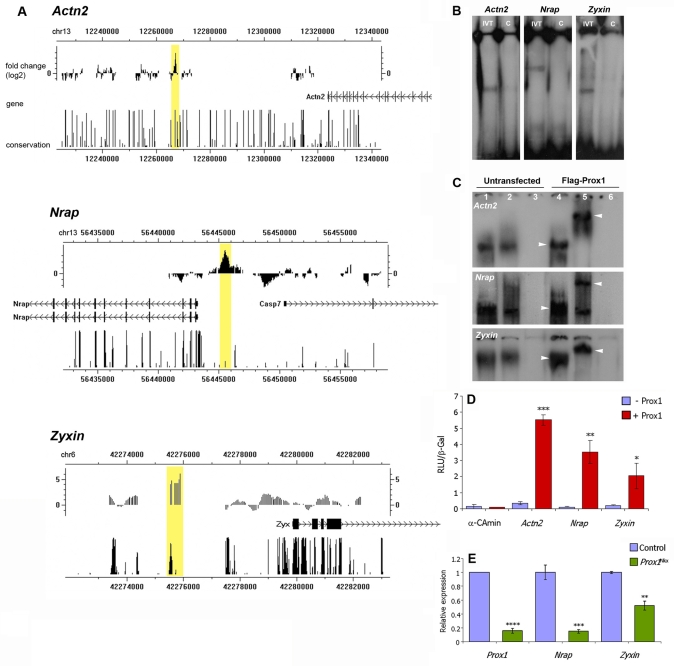
Prox1 directly regulates the genes encoding the structural proteins α-actinin, N-RAP and zyxin. (A) The sarcomere and sarcomere-related protein genes Actn2 (sarcomeric α-actinin), Nrap and Zyx were identified as potential downstream targets of Prox1 by ChIP-on-chip. For each locus, the genomic region immunoprecipitated by anti-Prox1 is indicated by a yellow box, the closest gene is labelled and the degree of conservation shown. Conservation patterns are based on phastCons scores (http://genome.ucsc.edu). (B) EMSAs with in vitro translated (IVT) Prox1 and 32P-labelled oligonucleotides (60 bp) identified from each of the Actn2, Nrap and Zyx putative Prox1-bound elements (see Fig. S9 in the supplementary material) isolated via the ChIP-on-chip shown in A. A 10-fold excess of unlabelled oligonucleotide was used in competitive assays as evidence of specific binding (lanes C). (C) EMSAs with nuclear extracts from mouse P19Cl6 cell lysates either untransfected (lanes 1-3) or transfected with Flag-Prox1 (lanes 4-6) and 32P-labelled elements as in B. Lanes 1 and 4 are lysate alone, lanes 2 and 5 are lysate plus an anti-Flag antibody, and lanes 3 and 6 are anti-Flag-alone controls. Note the evidence of a supershift in lane 5 compared with lane 4 for each of the Actn2, Nrap and Zyx elements (arrowheads), which is indicative of specific binding by Flag-Prox1. The presence of a comparatively weak band in lanes 1 and 2 in each case represents binding by endogenous Prox1, which is expressed in P19Cl6 cells (data not shown). (D) In vitro transcription assays demonstrate Prox1 transactivation of a luciferase reporter downstream of the Actn2, Nrap and Zyx putative Prox1-binding elements and minimal reporter. Note the significant activation by Prox1 of the Actn2, Nrap and Zyx reporters. (E) qRT-PCR for Nrap and Zyx confirms reduced expression of these factors in a Prox1-deficient background, as was previously determined for Actn2 (see Fig. 3O). In D,E, data are presented as mean ± s.e.m.; *P<0.05, **P<0.001, ***P<0.003, ****P<9×10⁻⁷.

