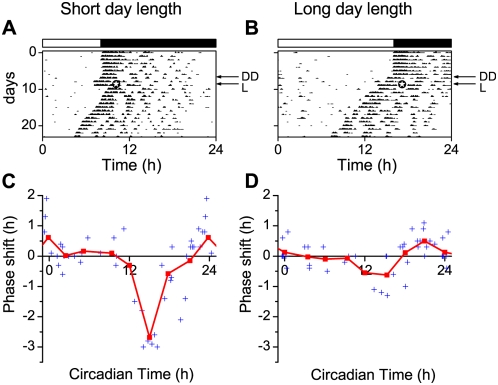
Figure 1. Phase shifts of wheel running behavior in mice induced by 30 minutes light pulses.
(A, B) Examples of wheel running actograms from animals kept in short (A) and long photoperiods (B). The actograms show the wheel running activity of the mice over the 24 h day. Consecutive days are plotted on successive lines. The top bar indicates the light-dark schedule before transfer to continuous darkness (DD, indicated with an arrow). A light pulse was given on day four in DD (L, indicated with an arrow), 3 hours after activity onset (indicated by  in the actogram). Activity onset was defined as circadian time 12. Phase response plots to 30 minute light pulses in short (C) and long (D) photoperiod. Phase responses are plotted as a function of the circadian time of the light pulse. Individual phase shifts are indicated by a plus symbol. The results were grouped in 3 h bins centered at CT 0, 3, 6, 9, 12, 15, 18 and 21. The average phase responses of the light pulses are indicated by squares and connected with a solid line. The time of maximal delay is at CT 15 for both long and short photoperiods and is significantly different between both day lengths (p<0.001). The large magnitude of the delays observed in short days is consistent with other studies [10], [11].

