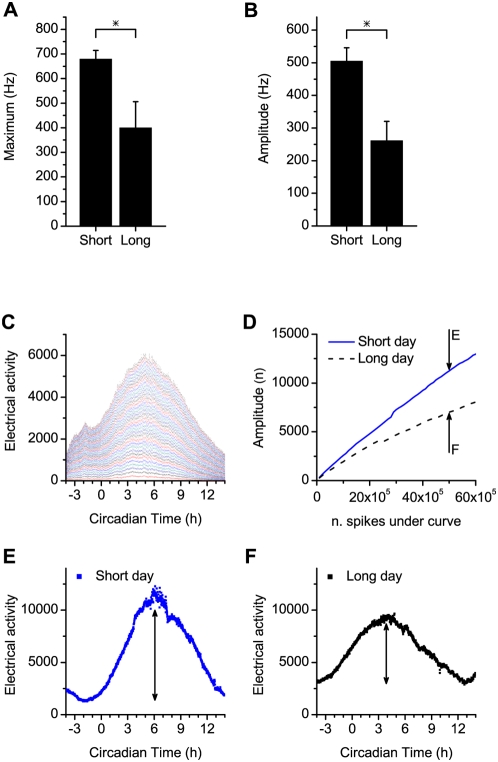
Figure 4. Amplitude of the electrical activity peak in short and long days.
(A) Maximal firing frequency in multiunit activity, recorded in slices from animals maintained in short and long days were significantly different (p<0.05). (B) Amplitudes of the multiunit activity rhythm, defined as the difference between maximal and minimum firing level, were significantly different between the short and long day groups (p<0.01). (C) An analysis was performed, in which the total number of action potentials contributing to the electrical activity pattern was determined. This allowed for a comparison of rhythm amplitude between the experiments for multiple sizes of subpopulations. Each line represents an increase over the lower line of a total number of 105 action potentials included in the recording. Action potentials were counted in 60 s bins. (D) Amplitude of electrical activity rhythms in subpopulations with a selected number of action potentials included in the recording. The amplitude of the electrical activity in the short day group is larger than the amplitude in the long day group for recordings with an equal number of action potentials. For 50×105 action potentials (indicated by arrows), examples of subpopulation electrical activity patterns are indicated in E and F. The difference in amplitude between long and short days exists for any number of action potentials contributing to the curve, and thus, for any subpopulation size. (E, F) Examples of electrical activity patterns obtained in short (E) and long (F) days, with the same total number of action potentials (50×105) making up the electrical activity pattern.

