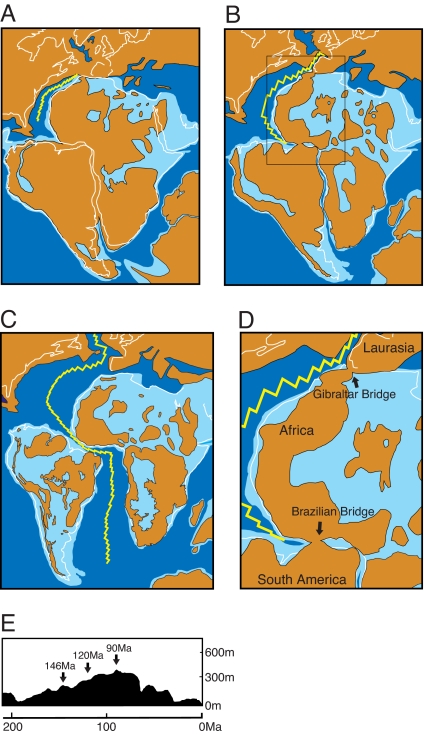
Fig. 3.
A revised paleogeographic scenario based on recent geological data. (A–C) Paleogeographic reconstruction of Pangea at 146 Ma (A), 120 Ma (B), and 90 Ma (C) (modified after refs. 43–48 and 52). (D) A magnified map at 120 Ma (boxed area in B) is shown emphasizing 2 bridges that connect 3 continents. Blue and light blue represent deep and shallow ocean depths, respectively. Brown areas and the yellow jagged line represent landmasses and the mid-Atlantic ridge, respectively. Only deep ocean is represented for Laurasia because drilling data are currently unavailable. (E) Sea-level rise (54) to yield subsequent fragmentation of Africa and South America was taken into consideration for the reconstruction.

