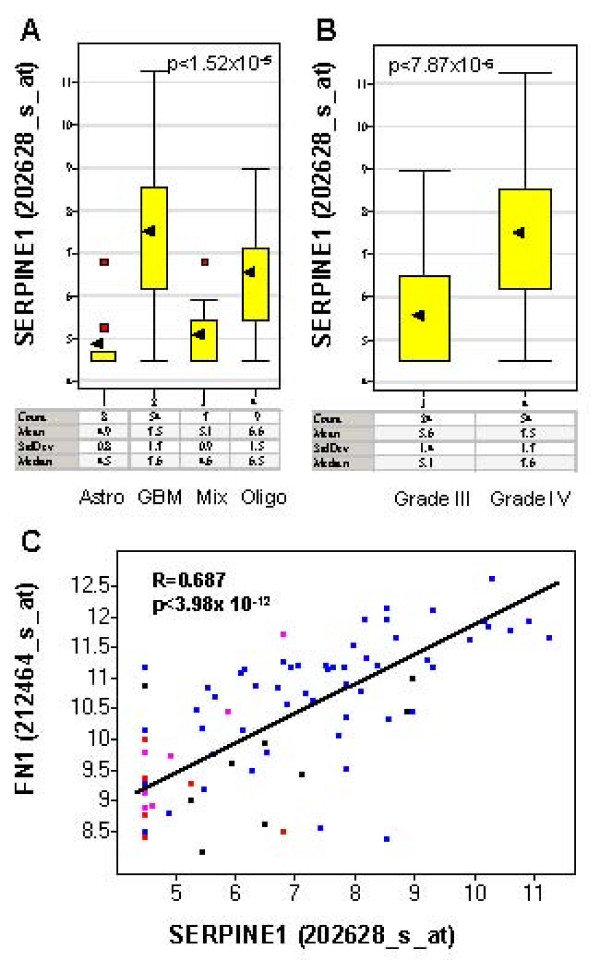
Figure 2.
The expression of TGFβ downstream targets SERPINE1 in glial tumors (the Freije dataset) shown in box plots. Y-axis is the expression level of SERPINE1 in log2 scale. The black arrow indicates the mean expression level of SERPINE1 in each type of gliomas. Red spots indicate the outlier samples. The table underneath of the box plots are the summary statistics (count, mean, standard deviation (StdDev), median) of the expression level of SERPINE1 by glioma types. A: Significant association of SERPINE1 expression and histology classification. SERPINE1 is significantly upregulated in glioblastoma (GBM) compared to anaplastic astrocytoma (Astro), anaplastic oligodendroglioma (Oligo) and mixed glioma, anaplastic oligoastrocytoma (Mix). The mean expression level of SERPINE1 is 6.1-fold higher in glioblastoma compared to anstrocytoma, 5.3-fold higher compared to mixed glioma and 1.9-folder higher compared to oligodendroglioma. P-value computed using ANOVA is indicated at the top right corner of the plot. B. Significant association of SERPINE1 expression and the grade of the tumor. SERPINE1 is significantly upregulated in grade IV tumors (GBM) compared to grade III tumors (Astro, Oligo, Mix). The mean expression level of SERPINE1 is 3.7-fold higher in grade IV tumors (GBM) than in grade III tumors. The P-value was computed using a t-test as indicated in the top left corner of the plot. C. The expression of SERPINE1 is highly correlated with FN1 expression in gliomas. The correlation coefficient (R) and P-value of correlation (p) were indicated in the plot. The histology types of the gliomas are indicated by colors (blue: GBM, red: Astro, pink: Mix, black: Oligo).

