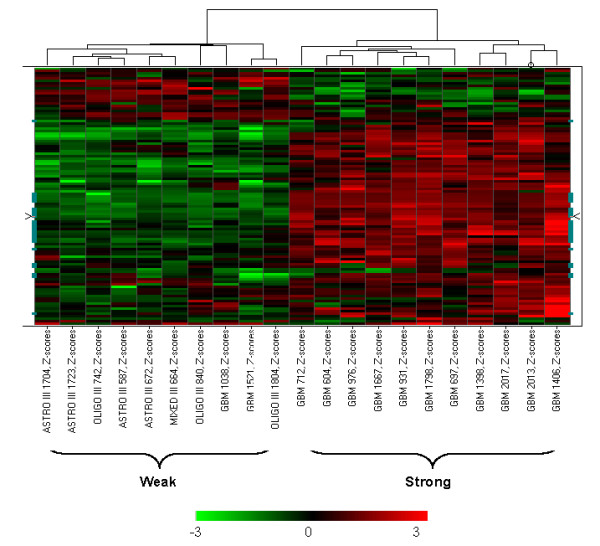
Figure 3.

The SVM training set showing distinct weak or strong TGFβ response pattern in the 103 classifiers that were selected from the most consistent TGFβ-responsive genes (in the Freije dataset). The data were Z-score transformed and the color range was indicated by the color bar below the heatmap. Each column represents a tumor sample and the tumor identification number is shown at the bottom of the column. These tumors were selected as training set for the SVM algorithm. Each row represents one of the 103 TGFβ-responsive probesets that were selected from the most consistent TGFβ-responsive genes. The orders of these genes are shown in Additional file 2.
