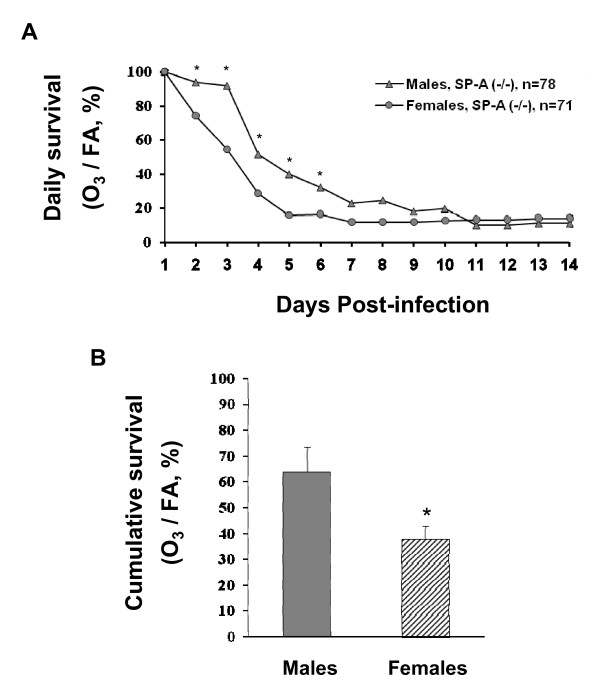
Figure 3.
Comparison of "cumulative" and daily survival rates between males and females of SP-A (-/-) mice after ozone-exposure followed by K. pneumoniae infection. Experimental design was performed as described in the legend for Figure 1 and Methods. Data are presented in percent. 3A: Differences in daily survival between males and females. Survival in the ozone group was calculated as percent of the control group (ozone/FA × 100%). For statistical analysis, proportions (ozone/FA absolute survival rates) for males and females were compared daily with the Z-test for each day. 3B: Differences in the "cumulative" survival between males and females. The experiments from which these data are derived are described in Figure 2 (for SP-A (-/-) mice). The area below the curve was calculated with Sigma Plot 10.0 Software for each experiment. The resulting ratios (ozone/FA × 100%) for males vs. females were compared with a t-test. Significant differences between males and females were noted if p < 0.05 (indicated with asterisk, *).

