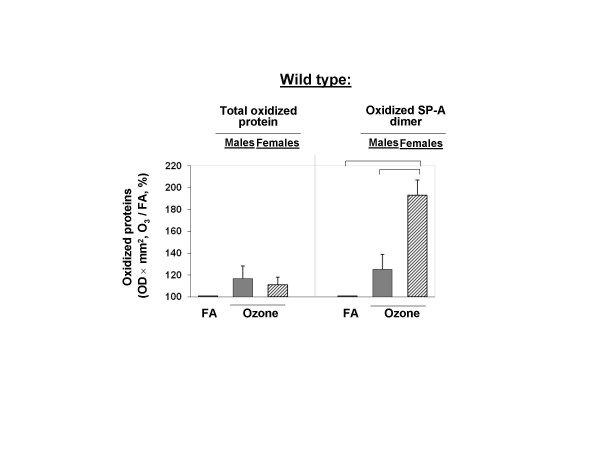
Figure 8.
Net effect of ozone exposure on total protein oxidation and SP-A oxidation in BAL of WT male and female mice. The data for ozone-exposed mice are from Figures 6B and 7B and they were normalized to the control (FA) that was set equal to 100%. The average of OD × mm2 for FA-exposed mice (control) was calculated for each experiment (n = 4). The net effect of ozone on total protein oxidation and SP-A oxidation in mouse BAL was calculated according to the following formula: OD × mm2 for each ozone-exposed mouse/OD × mm2 of the average for the FA-exposed mice from the same experiment, times 100%. Significant differences are shown with lines above the respective bars. Data were considered as significant if p < 0.05 with a t-test.

