Figure 3.

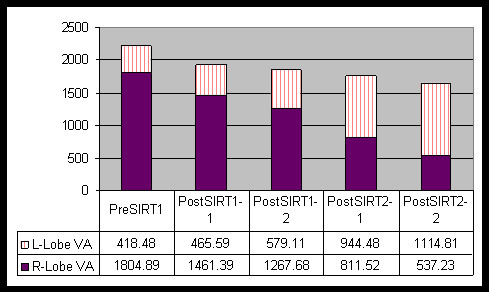
Graph analysis of left and right hepatic lobe volumes during the course of the treatment. Note the progressive increase in left lobe volume with concurrent decrease in the right lobe volume.

Graph analysis of left and right hepatic lobe volumes during the course of the treatment. Note the progressive increase in left lobe volume with concurrent decrease in the right lobe volume.