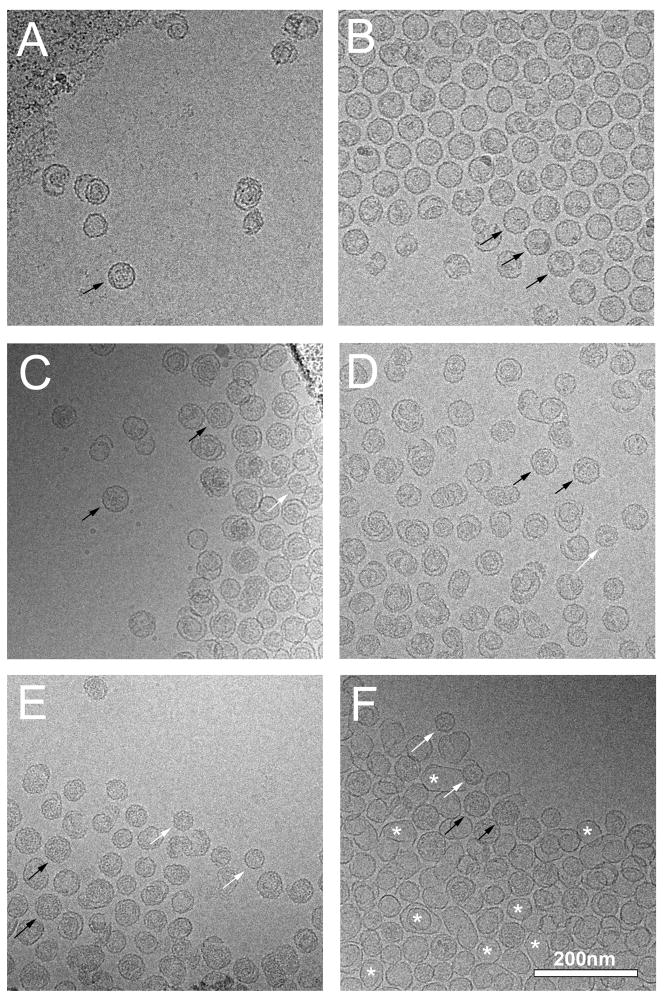
Figure 2.
Cryo-EM of structures produced by expression of gpN alone (A), expression of O(195–284)+N (B), O(244–284)+N (C), O(26–194)+N (D), O(26–283)+N (E), and O(26–C284S)+N (F). Examples of well-formed particles of P2 and P4 size are indicated in each panel (where available) by black (P2) and white (P4) arrows. Some of the many thin-walled shells in (F) are indicated with asterisks. Scale bar, 200 nm.

