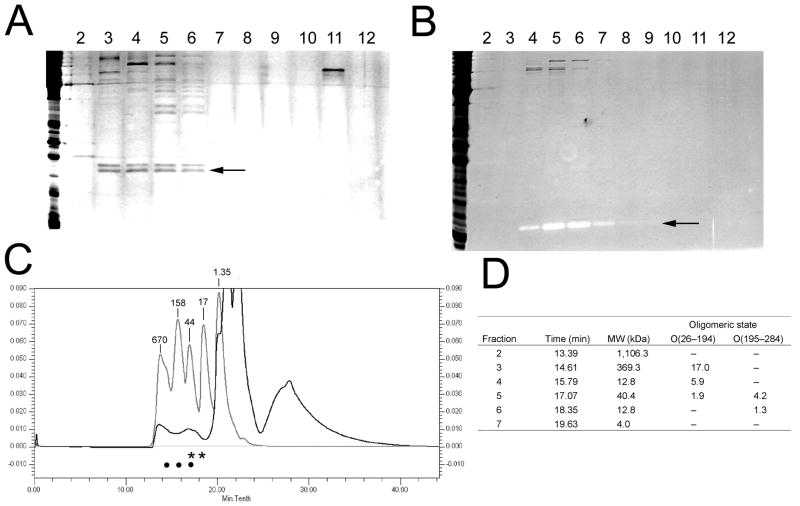
Figure 3.
Size exclusion chromatography of gpO truncations. Silver stained SDS-PAGE of fractions from the SEC separation of O(26–194) (A) and O(195–284) (B). The fraction numbers are shown above each lane. The bands corresponding to the truncated proteins are indicated (arrows). Note the contrast reversal for O(195–284) in (B). (C) Chromatogram of O(26–194) separation (black plot) superimposed on the chromatogram of a MW standard (light gray). UV absorption at 280 nm is plotted against the time of elution. The corresponding MW for each standard peak is indicated (in kDa). The large peak beyond 20 min elution time results from detergent in the buffer. The positions of the protein peaks determined from the gels of O(26–194) and O(195–284) in (A) and (B) are shown as bullets and asterisks, respectively. (D) Table showing the oligomeric state of O(26–194) and O(195–284) corresponding to the SEC fractions in which they were contained.

