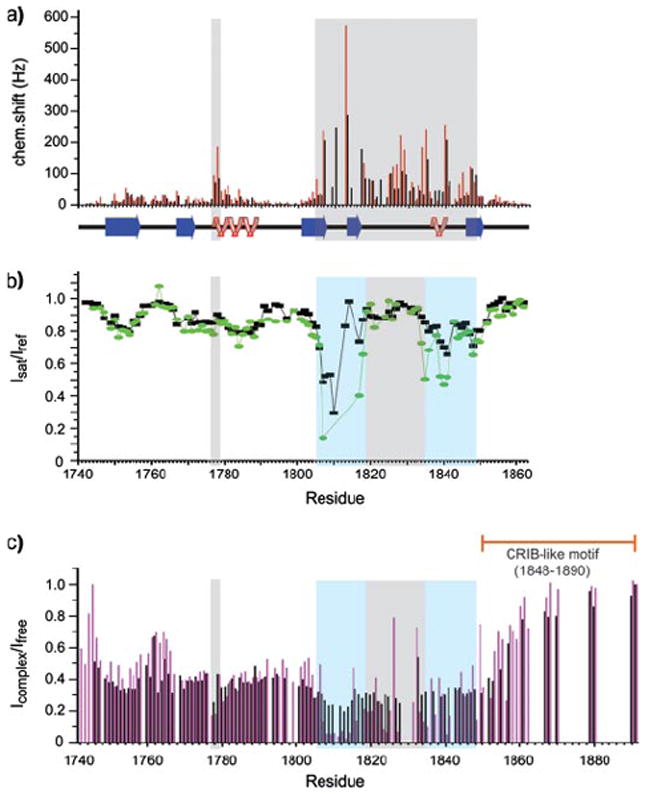
FIGURE 3.

a, weighted chemical shift changes from the free monomeric protein for Rac1 Q61L bound (black) and for Rnd1 bound (red) plexin-B1 construct E as a function of sequence. b, saturation transfer experiment (black for the RBD-Rac1 complex in 10% D2O, 90% H2O, and green for the complex in 85% D2O, 15% H2O. c, intensity ratio between signals from Rac1- (black) and RhoD-bound (magenta) plexin with those of the free plexin domain (construct F, residues 1743–1891). Regions responsible for Rho GTPases binding are shaded light blue in b and c, and region primarily involved in dimerization (28) is shaded gray.
